Cinco años pueden parecer un lapso breve, sin embargo, los frutos de la colaboración a largo plazo comienzan a manifestarse de manera cada vez más evidente. INGRUP, en conjunto con destacadas empresas de Centroamérica, así como con más de 1,000 empresas y gobiernos a nivel mundial, ha suscrito el Compromiso Global con el propósito de avanzar hacia la creación de una economía circular de los plásticos, contando con el apoyo de laFundación Ellen MacArthur.
Desde la firma en 2019 del Compromiso, nuestras empresas han tenido un impacto colectivo sustancia, tanto material y climático, hacia las metas que nos establecimos. En total, los firmantes hemos aumentado el uso de plásticos reciclados en +1.5 millones de tons. anuales e INGRUP, en 2022, duplicó la capacidad de reciclaje de sus instalaciones en Guatemala para la fabricación de más envases con plásticos reciclados. Junto a esto, se suman las estrategias de aligeramiento y reducción de empaques que se ha implementado para reducir el consumo de materias primas vírgenes y el rediseño de empaques más circulares y 100% reciclables.
Como la gran mayoría del plástico virgen se deriva de combustibles fósiles, al incrementar el uso de plásticos reciclados se ha logrado evitar la extracción de un barril de petróleo de la tierra tierra cada 2 segundos, que equivalen a más de 15 millones de barriles de petróleo al año que los firmantes del Compromiso dejamos de consumir. Al hacerlo, en conjunto hemos ahorrado al mundo 2.5 millones de toneladas de CO2 al año, que equivalen a haber eliminado las emisiones de CO2 de +2 millones de guatemaltecos (cada guatemalteco genera un promedio de 1.2 tons. de CO2/año).
El fuerte crecimiento en el uso de plásticos reciclados, combinado con mantener el crecimiento general en el uso de envases de plástico por debajo del promedio del mercado, ha resultado en evitar la producción de 2.8 millones de toneladas de plásticos vírgenes al año en comparación con lo habitual, lo que equivale a más +2 años de importaciones anuales de materias primas plásticas por toda Centroamérica.
Cinco años han pasado y se han logrado inmensos avances, sin duda, ¡los próximos 5 años tendrán nuevos retos y descubrimientos para acelerar la transición de nuestras industrias a un mundo cada vez más circular! ¡Vamos por más!
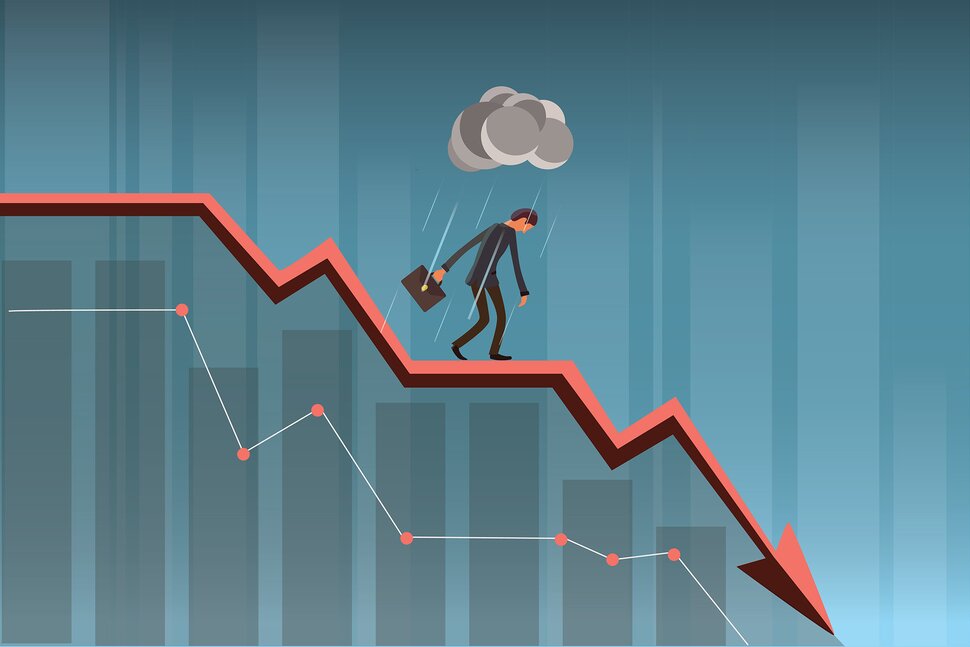
Desde el año pasado los expertos y analistas financieros indicaban que 2023 sería el año de la recesión y estanflación de las economías ricas y pobres. El mensaje era claro: “prepárense para reducir la inversión y la compra en sus compañías porque ha llegado el momento de ahorrar”. Sin embargo, ya vamos a la mitad del 2023 y el optimismo en el mercado sigue aún puesto en los mercados de Europa, Asia y América. Con todo y la crisis causada con las noticias desde Ucrania y los impactos del cambio climático, la economía sigue sin aterrizar finalmente en la recesión.
Pero los estrategas debemos estar siempre alerta y continuar observado la resiliencia de los mercados informales de las economías del sur global, la resiliencia que han mostrado los mercados laborales en el norte y las políticas fiscales que han reducido la inflación de los niveles que observamos en el 2022. En esta segunda parte del 2023 la desaceleración del crecimiento se observa como resultado de los ajustes de precios que durante ya dos años hemos visto en los costos de materias primas, energía y transporte. Los precios a los consumidores están más altos y los líderes de las organizaciones debemos ser cuidadosos antes de asumir que la economía está en recuperación.
Si algo nos ha enseñado el COVID es que las empresas modernas tienen la capacidad de adaptarse a los cambios de forma más veloz si cuentan con puestos gerenciales empoderados y educados en una visión común y objetivos previamente socializados. En condiciones de un lento ingreso a la recesión que hemos tenido en lo que va del 2023, es probable que observemos ya cómo muchos de nuestros gerentes se estén acomodando en la aparente recuperación de la economía. Sin embargo, aunque sí hay crecimiento, los costos de producción y transporte siguen estando altos reduciendo nuestros márgenes. Nuestro gran reto actualmente es comunicar este mensaje de forma cuidadosa a nuestros clientes y consumidores que empiezan a exigirnos una reducción más veloz de los costos de fabricación y de materias primas.
Para como va el año 2023, los mayores costos de crédito, un mercado más restringido y la volatilidad que hemos observado en los mercados financieros deben de ser factores a continuar observando. A estos factores, los problemas climáticos de las temporadas, el Niño y los conflictos bélicos que afectan las cadenas de logística deben sumarse como factores relevantes para todas las industrias. Lo que nos queda del 2023 seguirán siendo meses de una lenta pero consistente recuperación económica que no nos debe hacer bajar la guardia. El buen estratega es aquel que en la mejor parte de la batalla analiza los escenarios, tanto positivos como negativos, que podrían acercarse a la vuelta de la esquina. Y, para Centroamérica, esta visión implica seguir con atención los costos de las materias primas que continúan reaccionando a la volatilidad de los mercados. Para la región, la macroeconomía se perfila estable pero el pesimismo en los mercados estadounidense y europeo respecto a una futura recesión de sus economías aún en el 2024 debe de ser una alerta a seguir vigilando. La caída que se pronostica de la economía ante una recesión no deja de ser dolorosa aún si es una caída lenta “moderada o temporal” según explican los analistas financieros.
Si hemos de ser optimistas es en segmentar con claridad nuestro mercado y analizar cuidadosamente en qué somos realmente buenos dentro de nuestras industrias. Es en las recesiones que la inversión altamente rentable de capital permite a las empresas estratégicas salir a flote más rápido y mejor que el resto de sus competidores. Un lider con un enfoque claro y con un estudio de dónde invertira cada centavo durante esta recesión será un lider que podrá celebrar la victoria de records de ventas en los próximos meses. Y, concluyendo con una cita de Warren Buffet que se aplica como anillo al dedo en estas épocas de incertidumbre,
“Te diré el secreto para hacerte rico en Wall Street:
Intentas ser codicioso cuando los demás tienen miedo.
Y tratas de tener miedo cuando los demás son codiciosos.“
La evidencia es contundente cuando se correlaciona el incremento de la violencia y la alta desigualdad especialmente con la abundante investigación multidisciplinaria y los estudios realizados en las zonas más pobres del planeta. Algunos son los nombres de importantes académicos que han estudiado estos temas y es valioso mencionar los trabajos de Charles Tilly, quien fue uno de los primeros sociólogos en proponer que la desigualdad económica conduce a la violencia en su libro “The Politics of Collective Violence“. Junto a él, otros autores de diversas disciplinas han analizado tan complejos temas desde sus arenas de investigación. Desde el campo de la psiquiatría, James Gilligan estudio cómo la desigualdad social es un factor importante en el aumento de la violencia en las prisiones debido a que crea un ambiente de frustración y desesperación que puede conducir a la agresión. Para grupos sociales más amplios, los politólogos Joshua Goldstein y David Green elaboraron importantes estudios sobre estos temas explicando cómo la desigualdad económica es un factor importante en el estallido de las guerras civiles y en la creación de descontentos sociales que pueden conducir a la violencia. Para los estudios del sur global también se han realizado múltiples investigaciones y el informe “Atrapados: Alta desigualdad y bajo crecimiento en América Latina y el Caribe” del Programa de las Naciones Unidas para el Desarrollo (PNUD) ofrece una perspectiva actualizada de cómo al 2021 la región se encontraba atrapada entre la creciente desigualdad económica y el lento crecimiento económico de las economías. Partiendo de esta perspectiva de largo plazo, se evidencia que desde 1995 a la fecha tanto la tasa de homicidios como la desigualdad de ingresos han disminuido en América Latina. Sin embargo, las tasas de homicidio en América Latina continúan siendo significativamente superiores a los promedios mundiales que se ha mantenido influenciados por el crimen organizado, el narcotráfico y las maras que mantienen aún muy altos los niveles de la criminalidad en América Latina.
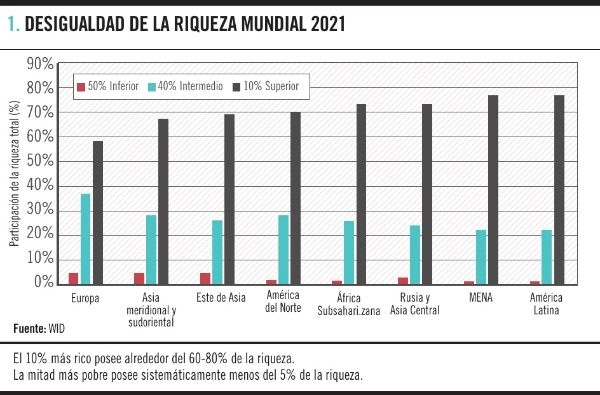
Como resultado de este crecimiento lento versus el resto de las economías del mundo, la violencia en la región de América Latina y el Caribe ha crecido y limitado la capacidad de progreso en los índices de desarrollo humano y económico. Ante esta situación, se suman las dificultades económicas generadas por COVID-19 que resultaron en un atraso del crecimiento de la región y en un encarecimiento generalizado de los costos de vida de los latinoamericanos. Antes de la pandemia la desigualdad económica en la región latinoamericana mostraba que el 45% de la riqueza se encontraba concentrada en el 10% más rico de la población. Este porcentaje se incrementó con la pandemia y la pérdida de empleos para millones de latinoamericanos que durante 2021 alcanzó casi un 24% afectando principalmente a los jóvenes entre 15 y 24 años. Como resultado, el desempleo y el crecimiento de la desigualdad económica repercutieron en todos los aspectos de la vida de los latinoamericanos, desde el acceso a la educación y la salud hasta las oportunidades de empleo y la participación política.
La historia de lento crecimiento económico en las últimas décadas ha sido en América Latina alrededor de un 2% anual según informa el PNUD y como resultado, se ha limitado la generación de empleos, la creación de nuevos negocios y se ha reducido la productividad de las industrias regionales. Lo anterior ha conllevado a que el crecimiento empresarial se mantenga muy reducido al control empresarial de un grupo y se reduzca el acceso al crédito para emprendimientos de escala nuevos. Asimismo, los Estados han fallado en extender el control del estado de bienestar mediante proyectos de fortalecimiento emprendedor, transferencias de crédito y fomento del empleo y sistemas de seguridad social y de educación para tecnificación de la mano de obra. El débil estado de los países latinoamericanos y el bajo gasto e inversión estatal ha resultado en pocos empleos, poca educación y malas condiciones sanitarias que redundan en incrementos del crimen en los grupos menos favorecidos de la población.
La desigualdad es un factor muy importante de la violencia, pero no es la única causa. Existen factores multidimensionales como la pobreza, la discriminación racial y la carencia de oportunidades para grupos vulnerables que también contribuyen a acentuar este problema y otros que aquejan al sur global. En el futuro, los gobiernos de la región deberán de afrontar las causas del crimen de forma integral buscando soluciones no solo a la discriminación económica, social y política sino mediante la implementación de políticas de bienestar que fomenten la creación de oportunidades, la igualdad y protección de grupos históricamente discriminados, la prevención de violencia y fortalecimiento de la justicia en alianza con el empresariado privado y las organizaciones de la sociedad civil.
El estudio de las crisis económicas ha sido uno de los principales campos de estudio y preocupación tanto de las ciencias económicas, como de las sociales, políticas e históricas. Desde sus áreas de experiencia y perspectivas, todos quienes se han aproximado al estudio de las crisis, sus causas y sus efectos han tenido distintas conclusiones, análisis de causalidad y propuestas para combatirlas y evitarlas. Durante décadas, sin embargo, las crisis económicas han continuado ocurriendo y resultando por y con las complejas relaciones creadas por la “mano invisible” del mercado que Adam Smith referenció como aquella en la que,
“El rico apenas consume más alimento que el vecino pobre. La calidad puede ser muy diferente y la preparación más delicada, pero, por lo que toca a la cantidad, es poca la diferencia. Pero compárese el espacioso palacio y la gran guardarropía del uno con la mísera choza y los harapos del otro y se hallará que la diferencia en albergue, vestido y ajuar es tan considerable en lo que respecta a la cantidad como a la calidad. El deseo de alimento se halla limitado en todos los seres humanos por la limitada capacidad de su estómago, pero el deseo de conveniencias, aparato mobiliario, ornato en la construcción, vestido y equipaje, parece que no tiene límites ni conoce fronteras”
Investigación sobre la naturaleza y causa de la riqueza de las naciones (Adam Smith, 1776)
En estas circunstancias de infinitas relaciones humanas y ambientales, las economías capitalistas modernas han debido plantearse soluciones ante las crisis económicas que una y otra vez han afectado a la humanidad. Ante estas situaciones cíclicas, distintas teorías en torno a las causas de las crisis económicas y las propuestas han abundado como soluciones. Algunas generalidades que podemos observar de las crisis económicas es que se han compuesto por las fases de (a) expansión y auge económico; (b) el inicio de la crisis, como el momento en el que la expansión se detiene y empieza el declive; (c) la caída, depresión o contracción económica y (d) la recuperación de la actividad económica.
En la antigüedad, las crisis económicas eran catastróficas y sus efectos resultaban principalmente de efectos ambientales como las malas cosechas consecutivas, las plagas y los desastres naturales. Como consecuencia, el auge económico se detenía e inmediatamente se observaba una depresión generalizada que resultaba en el hambre, enfermedades y reducción demográfica significativa. Posteriormente, la recuperación lenta iniciaba con una reducción de la oferta y demanda de productores y compradores que habrían de reconstruir las condiciones mínimas de sobrevivencia para poder empezar a consumir. Las guerras, además, contribuían a estas situaciones sumando tiempo a la duración de las crisis o alargando la recuperación. Desde la antigüedad, estas condiciones de crisis han acompañado a las economías agrarias, feudales y mercantilistas y, con el advenimiento del capitalismo y la economía mixta, se incrementaron y pronunciaron las causas y los efectos que creaban ciclos cada vez más complejos y dañinos.
El triunfo de la Muerte de Pieter Brueghel el Viejo es uno de los mejores ejemplos del impacto de las crisis en la época medieval
Durante los últimos dos siglos, los grandes debates entorno a las causas de las crisis y sus recuperaciones han involucrado relaciones complejas entre los mecanismos de precios, la capacidad productiva, la creación de plusvalía y la insuficiente demanda efectiva de los bienes y servicios generados por quienes controlan los bienes de producción. Al respecto, el sistema económico capitalista ha funcionado en ciclos económicos de expansión y depresión inevitables y que, a pesar de ser postergables, su retraso ha implicado crisis y efectos económicos más amplios. Ante esto, propuestas macroeconómicas en las últimas décadas han propuesto políticas que fomentan las crisis económicas con el fin de “enfriar” las economías y reducir los impactos complejos de la famosa metáfora smithiana de la mano invisible en acción.
Las crisis han evolucionado y sus impactos se han globalizado. De la misma manera, sus efectos son cada vez más desastrosos e impactantes en la sociedad, el medio ambiente y la estabilidad política de los países y cada crisis es ahora un “parteaguas” de la historia misma y sus efectos son cada vez más funestos.
A pesar de que muchos filósofos, políticos y economistas han buscado explicar y entender los ciclos económicos, aún nos quedan muchas dudas y respuestas respecto al análisis ético que de las mismas se debe realizar para entender los medios a implementar con tal de perseguir ese fin último en que creen los defensores del capitalismo para alcanzar niveles ¿realmente anhelados? de un crecimiento económico por siempre expansivo y de auge en el que no haya límites económicos, de bienes de producción, de capacidad productiva o medio ambientales. Tal y como con los terremotos y huracanes, su predicción y previsión es aún imposible pero cada vez más contamos con herramientas de análisis desde distintos sectores académicos para profundizar en las causas subyacentes y en los mecanismos adecuados en cada contexto para ralentizar las depresiones y reducir los efectos negativos en las poblaciones más vulnerables y los ambientes más sensibles. La tarea de los países del sur global reside en preparar a sus burocracias y elites empresariales para comprender el rol social que sus actividades individuales tienen para contribuir a estas previsiones y reducir los daños en las poblaciones sensibles de ancianos, mujeres y niños que suelen ser los grupos más afectadas en cada ciclo.
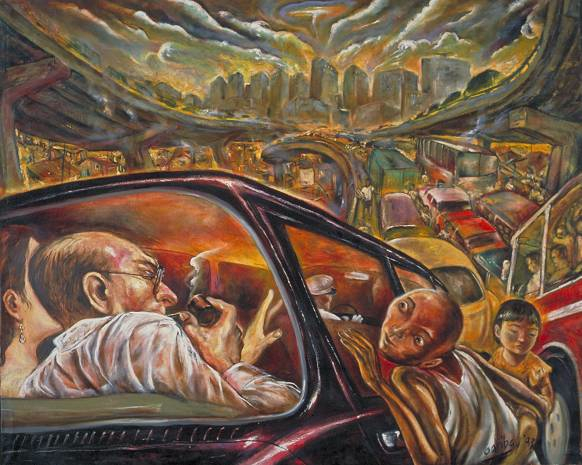
Pintura: Un encuentro en el camino de la fantasía. Autor: Emmanuel Garibay. Orige: Filipinas. (1993)
Los científicos tienden a indagar por respuestas cada vez más exactas y eficientes para la resolución de los conflictos que identifican en las teorías y postulados que predominan en sus campos. En la búsqueda por respuestas, las investigaciones que realizan los científicos pretenden describir la implementación de las teorías en la práctica y busca explicar cómo la investigación científica llega a conocer y explicar los procesos de la investigación. Al respecto, Thomas Kuhn se refería a estos procesos como paradigmas en los cuales existía un sistema de creencias y premisas que determinaban el actuar de la comunidad de científicos de una época. En ellos recaía partir del y en el paradigma y resolver preguntas a los problemas existentes para buscar nuevas soluciones que, potencialmente, dejarían a un paradigma vencido y caduco para dar vida a un nuevo paradigma científico.
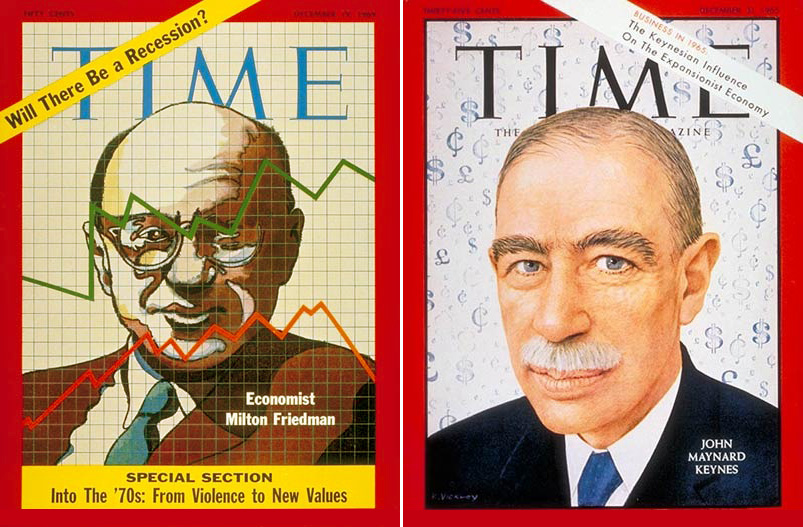
Los descubrimientos realizados por los keynesianos ofrecieron respuestas que permitieron solucionar los efectos negativos de los ciclos económicos y la reducción en la demanda de los consumidores durante las crisis económicas. Además, esta revolución respondió a muchas preguntas que habían quedado sin resolver en la revolución ricardiana y los estudios de economistas marginalistas y neoclásicos en el siglo XIX. De la teoría de Keynes surgieron muchas propuestas económicas innovadoras y una de las más importantes fue la intervención del Estado mediante el gasto público como mecanismo de estimulación de la demanda agregada en momentos de crisis económica y sus impactos directos para reducir y eliminar el desempleo durante estos períodos. Esta propuesta, junto a los estudios de Keynes y sus colegas respecto a los problemas agregado de la economía, los efectos del desempleo y la falta de inversión, la reducción de la producción y del consumo y sus impactos en el ahorro.
Los temas anteriores, convirtieron a Keynes y sus colegas en los autores de las bases de la economía moderna y, como consecuencia de esta teoría revolucionaria, gobiernos en todo el planeta implementaron estas estrategias keynesianas de incremento del gasto público para estimular la producción, empleos e inversión en un mundo cada vez más globalizado. El éxito de la teoría parecía haber conseguido los más importantes avances en muchas décadas; sin embargo, en la misma teoría keynesiana se encontraban las razones por las que una contrarrevolución económica surgiría y debatiría el aparente éxito keynesiano refutando muchos de sus postulados.
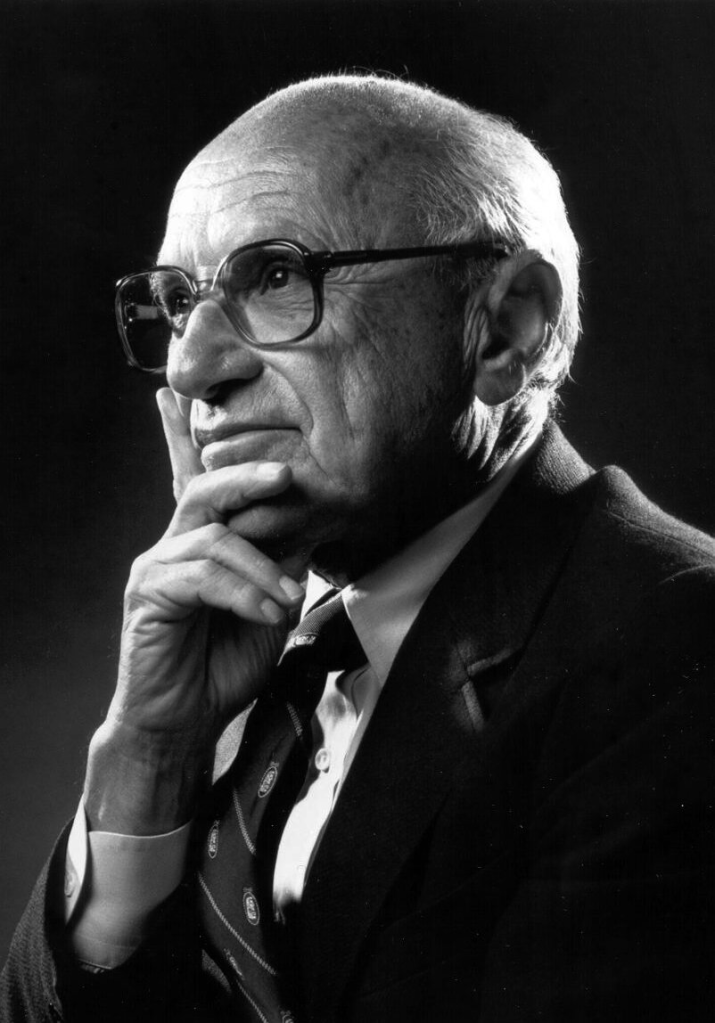
La contrarrevolución económica del monetarismo surgió como un esfuerzo de científicos que crecieron y aprendieron de académicos de la generación de Keynes y buscaron demostrar, probar y refutar los postulados teóricos keynesianos enfatizando un problema que ni Keynes ni sus colegas pudieron resolver: el problema de la inflación. Ante esto, los monetaristas explicaban los efectos a largo plazo del gasto público keynesianos para estimular la demanda agregada y enfatizaba la necesidad de controlar el excedente de oferta monetaria que se creaba con el gasto público.
Sin embargo, el keynesianismo tenía vulnerabilidades teóricas a las que se sumó “la incapacidad de prescribir el antídoto efectivo contra la inflación y la sujeción de las nuevas generaciones de estudiantes y profesionales de la ciencia económica a un liderazgo obsoleto.
El surgimiento de la nueva teoría monetarista resultó por la obvia irrelevancia que había alcanzado la ortodoxia económica al no tener respuestas a los problemas reales del momento y por el nuevo camino que creó la misma teoría keynesiana para que el monetarismo surgiera como una respuesta convincente. Independientemente de las refutaciones y nuevos descubrimientos teóricos realizados por la generación de Keynes y posteriormente por la generación de Friedman, una cosa es cierta, y ambas teorías fueron revolucionarias para resolver los problemas que el siglo XXI continuaría enfrentando para resolver las crisis económicas y establecer estrategias a nivel nacional que permitieran frenar, un poco, las crisis de la demanda, el desempleo y la inflación. El keynesianismo por su parte continúa siendo una teoría que explica y permite enfrentar las recesiones económicas y el desempleo de una mejor manera. Mientras que el monetarismo nos ofrece las soluciones más adecuadas para reducir la inflación que surge posterior a las crisis de demanda.
Actualmente continúan existiendo problemas económicos y sociopolíticos que hacen mucho más complejo el análisis de los economistas y académicos que intentan buscar soluciones para los efectos de los ciclos económicos y no tenemos aún respuestas definitivas. Es más, estos complejos retos del cálculo económico se vuelven en el siglo XXI aún más complejos con el surgimiento de la inteligencia artificial y las amenazas al empleo que los países desarrollados están enfrentando luego de la reciente crisis de la pandemia Covid-19. Tan solo en 2022, la industria de tecnología y sistemas digitales enfrentó despidos de casi un millón de empleados que, según explican analistas, serán reemplazados por la inteligencia artificial que sustituirá a estos humanos y realizará un trabajo muchísimo más eficiente y competitivo en términos de costos. Según el artículo publicado por Zippia.com, se calcula que de 2022 a 2030 se podrían perder 73 millones de empleos tan solo en Estados Unidos, equivalentes a 46% del total de empleos existentes en USA, que serán reemplazados por la automatización e inteligencia artificial en un proceso que se aceleró por la pandemia Covid-19. Sin duda, al respecto de estos temas ni Keynes o Friedman pudieron predecir lo que ocurriría en el futuro. Probablemente, estamos ante las puertas de nuevos descubrimientos que acabarán con ortodoxias económicas que, tal y como explica Johnson, deberán desafiar la vieja sabiduría en económica con un enfoque científico superior y estimar nuevas y desafiantes relaciones empíricas.